Personal Automation System and Information Dashboard
Note: This article is mainly translated by Google translator, please turn to the Chinese version for more accurate expression if possible.
For a while, I paid more attention to digital health and automation, so I tossed a wave of related things and engaged in data storage and Kanban. Recalling that the entire process feels like a micro data warehouse, you need to obtain the data source yourself, design the storage format and transfer it to the database, and then display the information in the database.
Automation and data collection
First, let’s talk about some of the information I care about and the process of data collection.
Android automation tool Tasker
Although I forgot why I studied Tasker in the first place, I look back on Tasker as a vital part of the entire system, so I give priority to the introduction.
The first is the choice of various automation tools. Unlike the ShortCuts shortcut application that almost dominates the world on IOS (mainly IOS has strict permissions, the official resource is the crown prince). There are many choices on Android. Tasker is more active. And Macrodroid, Tasker is an old-fashioned application that has existed a long time ago. There are many community-related resources, but Macrodroid’s UI is much better than Tasker. Because the focus is still on things, and the ability of Tasker to be more programmers (js/shell scripts, HTTP related), I bought Tasker.
There will be a tutorial when the software is opened for the first time. The following briefly describes some of the more important concepts:
- Variables: global variables that can be accessed and modified, used to store state
- Task: equivalent to a program, composed of a set of instructions, instructions can do various things, such as requesting HTTP API
- Trigger: A condition used to determine when to execute a task, which can be divided into:
- Event: When something happens, such as turning on the phone screen and scanning the NFC Tag
- Location: Triggered when entering a certain location, need to turn on positioning, GPS->WLAN->base station, power consumption and accuracy are reduced in turn
- Application: Triggered when an application is opened
- Time: trigger at a certain point in time
- State: Triggered when entering or leaving a certain state, such as when entering the battery> 10% state
- Configuration file: It is composed of trigger conditions and tasks, and the configuration of the task is executed when the trigger conditions are met
- Project: The top-level namespace, which can manage multiple sets of the above variables, tasks, triggers, and configuration files
The other information is combined with the specific application description below.
Daily management
The first thing I want to do is to record the “time of the occurrence of various events each day”, such as what time to get up and go to bed every day, when to go to get off work, and so on. The time to wake up and fall asleep depends on the bracelet. Let me talk about commuting and work records first.
The daily schedule can be summarized as
     通勤时间        工作时间           通勤时间
离家 <------> 到公司 <------> 离开公司 <------> 到家
As long as these four time points are recorded, the relevant time can be obtained. So how does the mobile phone learn about these events?
- This is the most direct way to use location information, but high-precision GPS positioning consumes a lot of power, and low-precision base station positioning is not accurate enough, and it takes a long time to react.
- Connect and disconnect via Wifi. Connected to the Wifi at home = home, disconnected from the Wifi at home = leaving home, the same goes for the company. However, this has a flaw. For example, if you disconnect the Wifi for a while when you are at home, it will be recorded as leaving home and returning.
- Wifi connection and disconnection + Wifi changes. This is an enhanced version of 2. If the Wifi I disconnected last time was at home, and the Wifi I connected this time belonged to the company, then I can be sure that connecting to Wifi this time means coming to the company. However, there is still a disadvantage, that is, it is difficult to determine whether the Wifi is really leaving the location of the Wifi when it is disconnected, because you don’t know what the next Wifi is connected to (you can only wait until the next Wifi connection to record) .
My current method is to use the third method to judge the event of entering the place, and to judge the leaving place by scanning the NFC Tag, like clocking in after get off work. In fact, if you want to change to delayed recording, pure Wifi is fine, but it is lazy.
The first thing to maintain is the information of the “Last Wifi”:
Profile: Anon (23)
  Restore: no
  State: Not Wifi Connected [SSID:* MAC:* IP:* Active: Any ]
Enter: Anon (27)

Profile: Anon (25)
  Restore: no
  State: Wifi Connected [SSID:* MAC:* IP:* Active: Any ]
Enter: Anon (29)

Task: Anon (27)
  A1: Variable Set [Name:%LastWIFI To:%CurrentWIFI ]
  A2: Variable Set [Name:%CurrentWIFI To:. ]

Task: Anon (29)
  A1: Test Net [Type: Wifi SSID Data: Store Result In:%CurrentWIFI ]
It is to update LastWifi when Wifi is disconnected, and assign value to CurrentWifi when Wifi is connected.
Then there are the records of going home and going to work:
Profile: 记录:到家 (8)
  Cooldown: 600 Restore: no
  Variables: [ %action: has value ]
  State: Wifi Connected [SSID: 爷斋小二 MAC:* IP:* Active: Any ]
Enter: Anon (30)

Task: Anon (30)
  A1: Wait [MS:0 Seconds:5 Minutes:0 Hours:0 Days:0 ]
  A2: If [ %CurrentWIFI neq %LastWIFI ]
  A3: HTTP Request [Method: GET URL: https://tracker.example.com/life-tracer/log-action?action=%action]
  A4: End If

Profile: 记录:到公司 (14)
  Cooldown: 600 Restore: no
  Variables: [ %action: has value ]
  State: Wifi Connected [SSID: ByteDance Inc MAC:* IP:* Active: Any ]
Enter: Anon (28)

Task: Anon (28)
  A1: Wait [MS:0 Seconds:5 Minutes:0 Hours:0 Days:0 ]
  A2: If [ %CurrentWIFI neq %LastWIFI ]
  A3: HTTP Request [Method: GET URL: https://tracker.example.com/life-tracer/log-action?action=%action]
  A4: End If
If there is a change during the Wifi connection, please request the built API to record the time. The API will be discussed later.
As for leaving home and leaving the company, it is triggered by NFC tags:
Profile: 记录:离公司 (16)
  Cooldown: 600 Restore: no
  Variables: [ %action: has value ]
  Event: NFC Tag [ID:048AFF32100289 Content: 下班 ]
Enter: Anon (9)

Task: Anon (9)
  A1: HTTP Request [Method: GET URL: https://tracker.example.com/life-tracer/log-action?action=离公司]
This requires an NFC tag and a mobile phone that supports NFC (which basically supports it now), write a specific value to the tag, or directly use the ID to determine the tag, and trigger the corresponding event when the tag is scanned. The NFC tag uses the NTAG215 coin card used in the previous Mock Switch Amiibo.Taobao link . The Android application NFC Tools Pro is a very useful tool for reading and writing NFC.
Although the NFC tag is sometimes tasteless, it’s just to clock in and record the time and tap the screen of the phone, but it’s still more ceremonial than pressing the button on the phone. It can be placed in a prominent position to remind you to scan, and it’s more efficient than unlocking the phone. Open the app to record high.
Body index
There are some health-related indicators, such as heart rate, sleep time, and daily steps, which are suitable for collection with smart bracelets or watches. However, it is troublesome to automatically collect and store these data. First of all, many devices do not support data export. There are many foreign devices that support Google Fit, but Google Fit only provides one-time or bi-monthly export. Not suitable for Kanban. Huawei’s watches have many functions, and various data algorithms are also very accurate. Unfortunately, they are too closed to get data. I found a third-party app on Mi BandNotify & Fitness for Mi Band It’s very open, you can export data, and support integration with Tasker through intent, so I decided to do it with Xiaomi bracelet and this app.
First, use the normal process to pair the official Mi Health app with the Mi Band, and then the Notify app can run with Mi Health, or take out the key of the Mi Health APP, Notify runs independently, and the Notify app has detailed instructions. Because Xiaomi’s health is bloated, I only use Notify.
The main beauty of the Notify application is that it can be automated through the Android intent mechanism combined with Tasker. Intent is a mechanism for transferring messages between different applications. Supported functions can be found in the official documentationBags integration There are mainly two types of receiving and sending. On the one hand, you can send out intents when various events occur, and on the other hand, you can do something when you receive intents. Exporting the data uses the “Export steps/sleep/heart/weight spreadsheet data” function. When receiving this intent, it will export the steps, sleep, heart rate, weight and other information into a csv file.
The weight and body fat are the Xiaomi body fat scales that I bought, and it can also be seamlessly integrated with the Notify app, so even though the body fat is not accurate, it is still convenient to use it.
Bags :
Profile: Sync Miband (19)
  Restore: no
  Time: Every 3h
Enter: 导出手环数据 (6)

Task:     导出手环数据 (6)
  A1: Send Intent [Action: com.mc.miband.syncData Target: Broadcast Receiver ]
  A2: Wait [Seconds:30]
  A3: Variable Set [Name:%start_time To:%TIMEMS-24*2*60*60*1000 ]
  A4: Send Intent [Action: com.mc.miband.taskerExportAllSpreadsheetData Extra: start:%start_time Target: Broadcast Receiver ]
  A5: Wait [Seconds:30]
  A6: Run Shell [Command: curl -u user:password -T /storage/emulated/0/miband/mibandnotify/export/exportHeart.csv https://drive.example.com/remote.php/dav/files/sine/Backup/Fitness/exportHeart.csv ]
  A7: Run Shell [Command: curl -u user:password -T /storage/emulated/0/miband/mibandnotify/export/exportSleep.csv https://drive.example.com/remote.php/dav/files/sine/Backup/Fitness/exportSleep.csv ]
  A8: Run Shell [Command: curl -u user:password -T /storage/emulated/0/miband/mibandnotify/export/exportSleepDetails.csv https://drive.example.com/remote.php/dav/files/sine/Backup/Fitness/exportSleepDetails.csv ]
  A9: Run Shell [Command: curl -u user:password -T /storage/emulated/0/miband/mibandnotify/export/exportWeight.csv https://drive.example.com/remote.php/dav/files/sine/Backup/Fitness/exportWeight.csv ]
  A10: Run Shell [Command: curl -u user:password -T /storage/emulated/0/miband/mibandnotify/export/exportSteps.csv https://drive.example.com/remote.php/dav/files/sine/Backup/Fitness/exportSteps.csv ]
  A11: HTTP Request [Method: GET URL: https://tracker.example.com/sync/mongo?items=miband ]
The above profile is executed every three hours, first send an intent to the Notify app to synchronize data from the bracelet, wait 30 seconds and then send a command to export the data of the past two days, wait for 30 seconds to export the data (enough), and then use Shell commands curl to send the exported csv file to the Nextcloud network disk (via the Webdav interface), and finally request the server to parse and store the exported data on the network disk.
The following is a script that parses the exported file and stores it in MongoDB. The analysis of sleep data is troublesome. There are multiple sleep stages and it is a messy array. I don’t know if it is accurate:
def add_heart_data():
    txt = get_fs_file_content('/Backup/Fitness/exportHeart.csv')
    df = pd.read_csv(StringIO(txt), sep=';')

    inserts = []
    for _, row in tqdm.tqdm(df.iterrows(), total=df.shape[0]):
        inserts.append({
            'ts': datetime.fromtimestamp(row['时间戳'] // 1000, timezone.utc).replace(microsecond=row['时间戳'] % 1000),
            'value': row['心率']
        })

    insert_docs('sine', 'heart_rate', inserts)

def add_step_data():
    txt = get_fs_file_content('/Backup/Fitness/exportSteps.csv')
    df = pd.read_csv(StringIO(txt), sep=';')

    inserts = []
    for _, row in tqdm.tqdm(df.iterrows(), total=df.shape[0]):
        inserts.append({
            'ts': datetime.fromtimestamp(row['时间戳'] // 1000, timezone.utc).replace(microsecond=row['时间戳'] % 1000),
            'value': row['步数']
        })

    insert_docs('sine', 'step', inserts)

def add_weight_data():
    txt = get_fs_file_content('/Backup/Fitness/exportWeight.csv')
    df = pd.read_csv(StringIO(txt), sep=';')

    inserts = []
    for _, row in tqdm.tqdm(df.iterrows(), total=df.shape[0]):
        inserts.append({
            'ts': datetime.fromtimestamp(row['时间戳'] // 1000, timezone.utc).replace(microsecond=row['时间戳'] % 1000),
            'value': row['体重']
        })

    insert_docs('sine', 'weight', inserts)

    inserts = []
    for _, row in tqdm.tqdm(df.iterrows(), total=df.shape[0]):
        inserts.append({
            'ts': datetime.fromtimestamp(row['时间戳'] // 1000, timezone.utc).replace(microsecond=row['时间戳'] % 1000),
            'value': row['Fat']
        })

    insert_docs('sine', 'fat', inserts)

def add_sleep_data():
    txt = get_fs_file_content('/Backup/Fitness/exportSleepDetails.csv')
    df = pd.read_csv(StringIO(txt), sep=';')

    events = []
    stage_map = {
        'wake': 5,
        'rem': 4,
        'stage1': 3,
        'stage2': 2,
        'stage3': 1,
        'stage4': 0,
    }
    miband_map = {
        '浅睡': 'stage1',
        '深睡': 'stage3',
        '清醒': 'wake',
        'REM': 'rem',
    }

    for _, row in df.iterrows():
        events.append((row['开始睡眠'], 'in', miband_map[row['睡眠类型']]))
        events.append((row['醒来'], 'out', miband_map[row['睡眠类型']]))

    events.sort(key=lambda e: e[0])

    state = 'wake'
    stage_cnt = {
        'wake': 1,
        'rem': 0,
        'stage1': 0,
        'stage2': 0,
        'stage3': 0,
        'stage4': 0,
    }
    inserts = []
    for idx, evt in enumerate(events):
        if evt[1] == 'in':
            stage_cnt[evt[2]] += 1
        else:
            stage_cnt[evt[2]] -= 1

        if idx == len(events) - 1 or events[idx + 1][0] > evt[0]:
            for k in reversed(stage_cnt.keys()):
                if stage_cnt[k] > 0 and k != state:
                    ts = datetime.fromtimestamp(
                        evt[0] // 1000, timezone.utc).replace(microsecond=evt[0] % 1000)
                    inserts.append({
                        'ts': ts,
                        'value': stage_map[k],
                    })
                    state = k
                    break

    insert_docs('sine', 'sleep', inserts)
Notify also has the function of sending intents when sleeping and waking up, so it can record the time of sleep, but there is usually a delay of about ten minutes:
Profile: 记录:睡着 (3)
  Restore: no
  Variables: [ %action:has value ]
  Event: Intent Received [ Action:com.mc.miband.tasker.fellAsleep ]
Enter: Anon (31)

Task:     Anon (31)
  A1: HTTP Request [  Method:GET URL:https://tracker.example.com/life-tracer/log-action?action=%action ]
  A2: Wait [ MS:0 Seconds:0 Minutes:15 Hours:0 Days:0 ]
  A3: Media Control [ Cmd:Pause Simulate Media Button:On Package/App Name: 网易云音乐 Use Notification If Available:Off ]

Profile: 记录:醒来 (4)
  Restore: no
  Variables: [ %action:has value ]
  Event: Intent Received [ Action:com.mc.miband.tasker.wokeUp ]
Enter: Trace POST (2)

Task:     Trace POST (2)
  A1: Wait [ MS:0 Seconds:10 Minutes:0 Hours:0 Days:0 ]
  A2: HTTP Request [  Method:GET URL:https://tracker.example.com/life-tracer/log-action?action=%action ]
Both sleeping and waking up will request the API to record the event, and when sleeping, the music being played will be additionally closed.
Digital health
Digital Wellbeing mainly advocates not to be dominated by electronic equipment, which is wasting a lot of unnecessary energy. Specific to the usage is to count the time used by each application.
Cell phone
The first is the mobile phone. Tasker comes with the function of getting the application usage time from the Android system, but I don’t know why the time recorded by this system function is horribly inaccurate, and there is a lack of documentation. It is not clear whether it is the process running time or the screen usage time. Later, I couldn’t bear it and decided I used Tasker to record:
Profile: Phone Usage - Change (38)
  Restore: no
  Event: App Changed [ Output Variables:* Package:* ]
Enter: Anon (39)

Task:     Anon (39)
  A1: If [ %CurrentAPP neq . ]
  A2: Variable Set [ Name:%usageTime To:%TIMES-%APPOpenTime ]
  A3: JavaScriptlet [ Code:let l = []
    try {
      l = JSON.parse(global("APPUsageList"))
    } catch (err) {
      l = []
    }
    l.push({ts: global("APPOpenTime"), name: global("CurrentAPP"), package: global("CurrentPackage"), time: global("usageTime")})
    setGlobal("APPUsageList", JSON.stringify(l)) Libraries: Auto Exit:On Timeout (Seconds):45 ]
  A5: End If
  A6: Variable Set [ Name:%CurrentAPP To:%app_name ]
  A7: Variable Set [ Name:%CurrentPackage To:%app_package ]
  A8: Variable Set [ Name:%APPOpenTime To:%TIMES ]


Profile: Phone Usage - Screen (40)
  Restore: no
  Event: Display Off
Enter: Anon (41)

Task:     Anon (41)
  A1: If [ %CurrentAPP neq . ]
  A2: Variable Set [ Name:%usageTime To:%TIMES-%APPOpenTime ]
  A3: JavaScriptlet [ Code:let l = []
    try {
      l = JSON.parse(global("APPUsageList"))
    } catch (err) {
      l = []
    }
    l.push({ts: global("APPOpenTime"), name: global("CurrentAPP"), package: global("CurrentPackage"), time: global("usageTime")})
    setGlobal("APPUsageList", JSON.stringify(l)) Libraries: Auto Exit:On Timeout (Seconds):45 ]
  A4: End If
  A5: Variable Set [ Name:%CurrentAPP To:. ]
  A6: Variable Set [ Name:%APPOpenTime To:. ]

Profile: Sync Phone Usage (43)
  Priority: 4 Restore: no
  Time:  Every 1h
Enter: Anon (44)

Task:     Anon (44)
  A1: HTTP Request [  Method:POST URL:https://tracker.example.com/phone_usage Body:%APPUsageList ]
  A2: Variable Set [ Name:%APPUsageList To:[] ]
The specific content can be seen in the task description. The use time of the currently opened APP is recorded through several global variables, and the use of the last APP is included in the APPUsageList when the APP is switched. Finally, the current APPUsageList is sent to the APPUsageList at regular intervals. Document the API. Tasker’s variables only support string types, so if you want to store more complex JSON format, you need to write scripts. Fortunately, Tasker supports JavascriptLet type tasks, you can run JS code directly, so you can achieve more complex logic.
computer
The system on Mac comes with time statistics (but it cannot be exported, but the problem is not big, and you can see it anyway). There is no software on Windows. There is software that can count time, but there is no export function. I had to write a script for statistics by myself:
import time
import win32gui
import win32process
import win32pdh
import uiautomation as auto
import psutil
import json
from urllib.parse import urlparse
from datetime import datetime, timezone
import requests
import copy
import logging
from win10toast import ToastNotifier
import os
import traceback
import re
from io import StringIO

logging.basicConfig(filename=os.path.join(
    __file__, '../logs.log'), level=logging.INFO, format='[%(asctime)s][%(levelname)s] %(message)s')

def get_chrome_active_domain(handle):
    ctl = auto.ControlFromHandle(handle)
    tmp = ctl.PaneControl(Depth=1, Name='Google Chrome').GetChildren()[
        1].GetChildren()[0]
    found = False
    for bar in tmp.GetChildren():
        last = bar.GetLastChildControl()
        if last and last.Name != '':
            found = True
            break
    if found:
        addr_bar = bar.GroupControl(Depth=1, Name='').EditControl()
        url = addr_bar.GetValuePattern().Value
        if '://' not in url:
            url = f'http://{url}'
        domain = urlparse(url).netloc
        if not re.match(r'([\S]+(\.[\S]+)+)|(\S+:\d+)', domain):
            return None
        return domain
    else:
        return None

process_name_map = {
    'chrome.exe': 'Chrome',
    'code.exe': 'VS Code',
    'explorer.exe': 'File Explorer',
    'powershell.exe': 'Powershell',
    'wechat.exe': 'Wechat',
    'element.exe': 'Element',
    'qq.exe': 'QQ',
    'cloudmusic.exe': '网易云音乐',
}

def check():
    wh = win32gui.GetForegroundWindow()
    title_text = win32gui.GetWindowText(wh)
    tid, pid = win32process.GetWindowThreadProcessId(wh)
    process = psutil.Process(pid)
    process.as_dict()
    process_name = str(process.name()).lower()
    child_path = []
    if process_name == 'chrome.exe' and ' - ' in title_text:
        domain = get_chrome_active_domain(wh)
        child_path.append(domain)
    elif process_name == 'code.exe':
        child_path.append(title_text.split(' - ')[-2])

    return {
        'process_name': process_name,
        'program_name': process_name_map.get(process_name, process_name),
        'window_title': title_text,
        'child_path': child_path,
        'ts': datetime.utcnow(),
    }

def state_changed(a, b):
    if a['process_name'] != b['process_name']:
        return True
    if len(a['child_path']) != len(b['child_path']):
        return True
    if any(map(lambda t: t[0] != t[1], zip(a['child_path'], b['child_path']))):
        return True
    return False

toaster = ToastNotifier()
toaster.show_toast("Desktop Usage Tracker", "Tracking started.", duration=10)

usages = []
last_app = None
last_send_time = datetime.now()
while True:
    try:
        tpassed = (datetime.now() - last_send_time).total_seconds()
        if tpassed > 60 * 10 and len(usages) > 0:
            try:
                logging.info(f'{tpassed:.2f} seconds passed, sending usages')
                res = requests.post(
                    'https://tracker.example.com/desktop_usage', json=usages)
                usages = []
                last_send_time = datetime.now()
                logging.info('sending done')
            except Exception as err:
                logging.error(f'failed to send usage: {err}')

        app = check()
        if not last_app or state_changed(last_app, app):
            tmp = copy.deepcopy(last_app) if last_app else copy.deepcopy(app)
            tmp['time'] = (datetime.utcnow() -
                                tmp['ts']).total_seconds()
            tmp['ts'] = tmp['ts'].replace(tzinfo=timezone.utc).timestamp()
            if tmp['process_name'] == 'chrome.exe' and len(tmp['child_path']) > 0:
                if not isinstance(tmp['child_path'][0], str) or not re.match(r'([\S]+(\.[\S]+)+)|(\S+:\d+)', tmp['child_path'][0]):
                    tmp['child_path'] = []
            if len(usages) > 0 and usages[-1]['ts'] == tmp['ts']:
                usages[-1] = tmp
            else:
                usages.append(tmp)
            last_app = app
    except Exception as err:
        logging.error(f'exception: {err}')
        s = StringIO()
        traceback.print_tb(err.__traceback__, file=s)
        logging.error(s.getvalue())
    time.sleep(0.5)
The above script will get the currently active window every half a second, and if the window changes, it will record the usage of the previous window (start, end). Special processing is done for the more commonly used software, you can get the domain name of the current tab of Chrome and the project that VSCode is working on. Mainly used various Windows-related packages. Finally, the usage status will be reported to the API regularly for data recording.
If you want this script to start on boot, you need toC:\Users\<name>\AppData\Roaming\Microsoft\Windows\Start Menu\Programs\Startup Create a new one under the directoryvbs File, the content is:
DIM objShell
set objShell=wscript.createObject("wscript.shell")
iReturn=objShell.Run("""C:\ProgramData\Miniconda3\python.exe"" ""D:\Project\LifeTracker\DesktopTracker\track.py""", 0, TRUE)
This will run the script in the background every time it starts.
data storage
The foregoing mainly describes the source of various data. After the data is collected, it is sent to the server through the API, and the server does some simple processing and stores it in the database.
In terms of databases, most of the data is time indexed, and you can use relational databases, document databases, or time series databases. Considering that the relational database is not flexible enough, and the function of the time series database is relatively specific and the performance requirements are not so high, I decided to use the more convenient document database MongoDB for storage.
MongoDB’s docker-compose file:
---
version: "2.1"
services:
  mongodb:
    image: mongo:latest
    container_name: mongodb
    environment:
      - PUID=1000
      - PGID=1000
      - MONGO_INITDB_ROOT_USERNAME=x
      - MONGO_INITDB_ROOT_PASSWORD=x
    volumes:
      - /home/sine/service/mongodb/data:/data/db
    ports:
      - 2012:27017
    restart: unless-stopped
The API service is built with Flask, and its main function is to receive and write data from HTTP:
@app.route('/life-tracer/log-action')
def log_action():
    action = request.args.get('action')
    insert_docs('sine', 'daily_events', [{
        'ts': datetime.datetime.utcnow().replace(tzinfo=datetime.timezone.utc),
        'event': action
    }])
    send_qq_msg(123456, f'记录: {action}')
    return '200 OK'

@app.route('/sync/mongo')
def sync_mongo():
    items = request.args.get('items')
    items = items.split(',')
    for item in items:
        if item == 'miband':
            add_step_data()
            add_heart_data()
            add_sleep_data()
            add_weight_data()
        elif item == 'thermometer':
            add_thermometer_data()
        elif item == 'waka':
            add_wakatime_data()
    return '200 OK'

@app.route('/phone_usage', methods=['POST'])
def phone_usage():
    data = request.get_json(force=True)
    updates = []
    for d in data:
        try:
            ts = datetime.datetime.utcfromtimestamp(int(d['ts']))
            updates.append(UpdateOne({'ts': ts}, {'$set': {
                'ts': ts,
                'name': d['name'],
                'package': d['package'],
                'time': int(d['time']),
            }}, upsert=True))
        except Exception as err:
            print(err)
    bulk_write('sine', 'phone_usage', updates)

    return '200 OK'

@app.route('/desktop_usage', methods=['POST'])
def desktop_usage():
    data = request.get_json(force=True)
    updates = []
    for d in data:
        ts = datetime.datetime.utcfromtimestamp(d['ts'])
        updates.append(UpdateOne({'ts': ts}, {'$set': {
            **d,
            'ts': ts
        }}, upsert=True))
    bulk_write('sine', 'desktop_usage', updates)

    return '200 OK'

@app.route('/thermometer_report')
def thermometer_report():
    temperature = request.args.get('temperature')
    humidity = request.args.get('humidity')

    client['sine']['room_metrics'].insert_one({
        'ts': datetime.datetime.utcnow(),
        'temperature': float(temperature),
        'humidity': float(humidity),
    })

    return '200 OK'
/life-tracer/log-action Can record events that occur at a certain point in time,/sync/mongo It is used to parse the data uploaded to Nextcloud and store it in the database. There are also scripts for processing Wakatime data, which can count the daily code writing. The Wakatime free API only provides detailed data for seven days, which can be stored for a long time./phone_usage with /desktop_usage It’s an API for saving related script data in the section on digital health. Finally,/thermometer_report For storage inUse Raspberry Pi for temperature and humidity reporting and infrared control Room temperature and humidity data mentioned in.
Data Kanban
The ETL process of the data has been completed before, and there is still the last step: data display and analysis. This is achieved through Grafana Kanban.
Grafana’s docker-compose file:
---
version: "2.1"
services:
  grafana:
    image: grafana/grafana:latest
    container_name: grafana
    environment:
      - PUID=1000
      - PGID=1000
      - GF_PATHS_CONFIG=/var/lib/grafana/config.ini
    volumes:
      - /home/sine/service/grafana/data:/var/lib/grafana
    ports:
      - 2013:3000
    restart: unless-stopped
Grafana’s official MongoDB data source plug-in requires a paid enterprise version to use, so here is a plug-in from the communitymongodb-grafana-backend , But this plugin is not signed, you need to manuallyconfig.ini This plugin is allowed in the configuration file:
[plugins]
allow_loading_unsigned_plugins = grafana-mongodb-backend-datasource
Although another MongoDB pluginmongodb-grafana There are many stars, but it is forwarded through a node service by Lingqi, which is extremely inelegant in Docker, so the previous plug-in that does not require back-end services is used. As for installation, refer to the README and copy the corresponding directory to Grafana’s plugin, and then restart the Grafana service.
In addition, Plotly panel is used to draw pictures through js, and Pie Chart plug-in, both of which can be searched and installed on Grafana’s settings page.
Put a complete picture first:
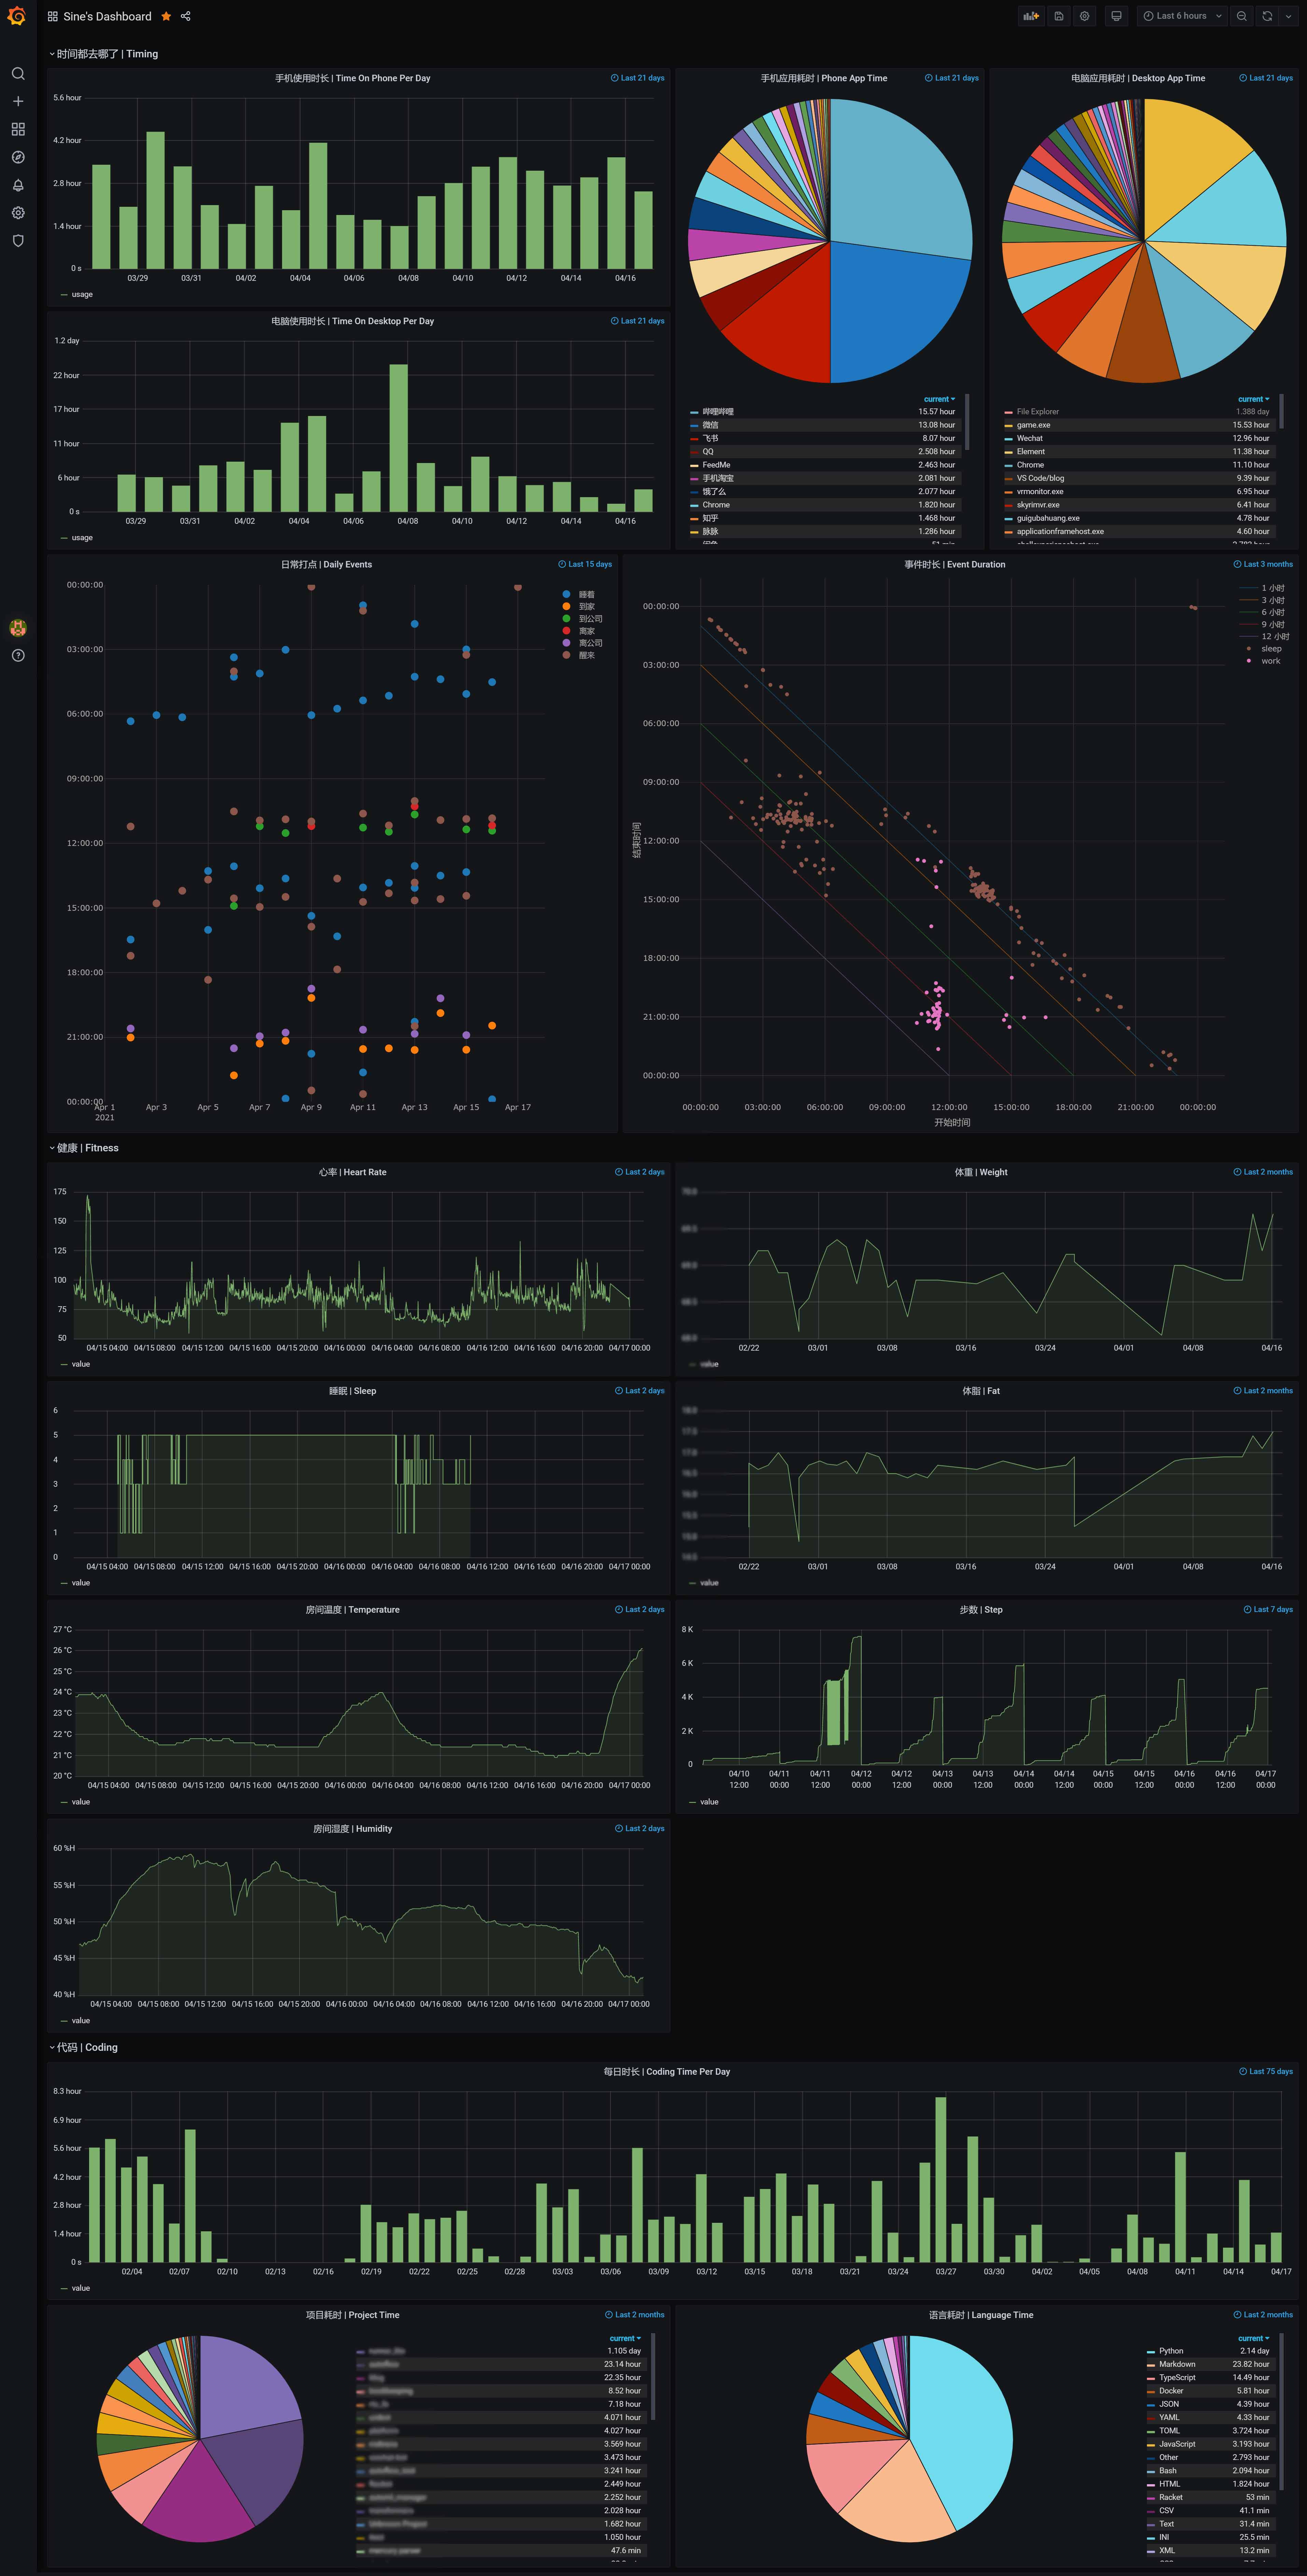
Let’s take a look at the implementation of several of these panels.
Daily mobile phone usage time is a regular query
[
  {"$match": {"ts": {"$gte": "$from", "$lt" : "$to"}}},
  {"$match": {"name": {"$ne": "一加桌面"}}},
  {"$group": {
    "_id": {"$dateToString": {"format": "%Y-%m-%d", "date": "$ts"}},
    "time": {"$sum": "$time"}
  }},
  {"$project" : {"name" : "usage", "value" : "$time", "ts" : {"$toDate": "$_id"}, "_id" : 0}},
  {"$sort": {"ts" : 1}}
]
Take out the data of a specific time period, filter out meaningless applications, and then sum up in units of days, and finally map to the specified format of the plug-in.
Pie chart of the usage time of mobile apps in the past period of time:
[
  {"$match": {"ts": {"$gte": "$from", "$lt": "$to"}}},
  {"$group": {
    "_id": "$name",
    "total": {"$sum": "$time"}
  }},
  {"$redact": {
    "$cond": [
      {"$gt": ["$total", 300]},
      "$$KEEP",
      "$$PRUNE"
    ]
  }},
  {"$sort": {"total": -1}},
  {"$match": {"_id": {"$nin": ["一加桌面", "Root Explorer", "CaptivePortalLogin"]}}},
  {"$project": {"name": "$_id", "value": "$total", "_id": 0}}
]
Filter by time, sum by name, then filter out applications that have been used for more than 5 minutes, and finally convert the format.
Line chart of weight:
[
  {"$match": {"ts": {"$gte": "$from", "$lt": "$to"}, "value": {"$gte": 50}}},
  {"$sort": {"ts": 1}},
  {"$project": {"name": "value", "value": "$value", "ts": "$ts", "_id": 0}}
]
It’s very simple. It should be noted that if the returned data is not sorted according to the event, the function of the mouse hover will be messy.
The data conversion of bar chart, pie chart, and line chart is included in the previous section, all of which can be easily realized by the built-in plug-in. Daily management and event duration are more difficult to do, because Grafana still focuses on the display of time series data. For example, the daily dot chart and scatter chart with a vertical line in the figure are not our business, and we need to rely on the external plugin Plotly.js to support.
First look at the daily management:
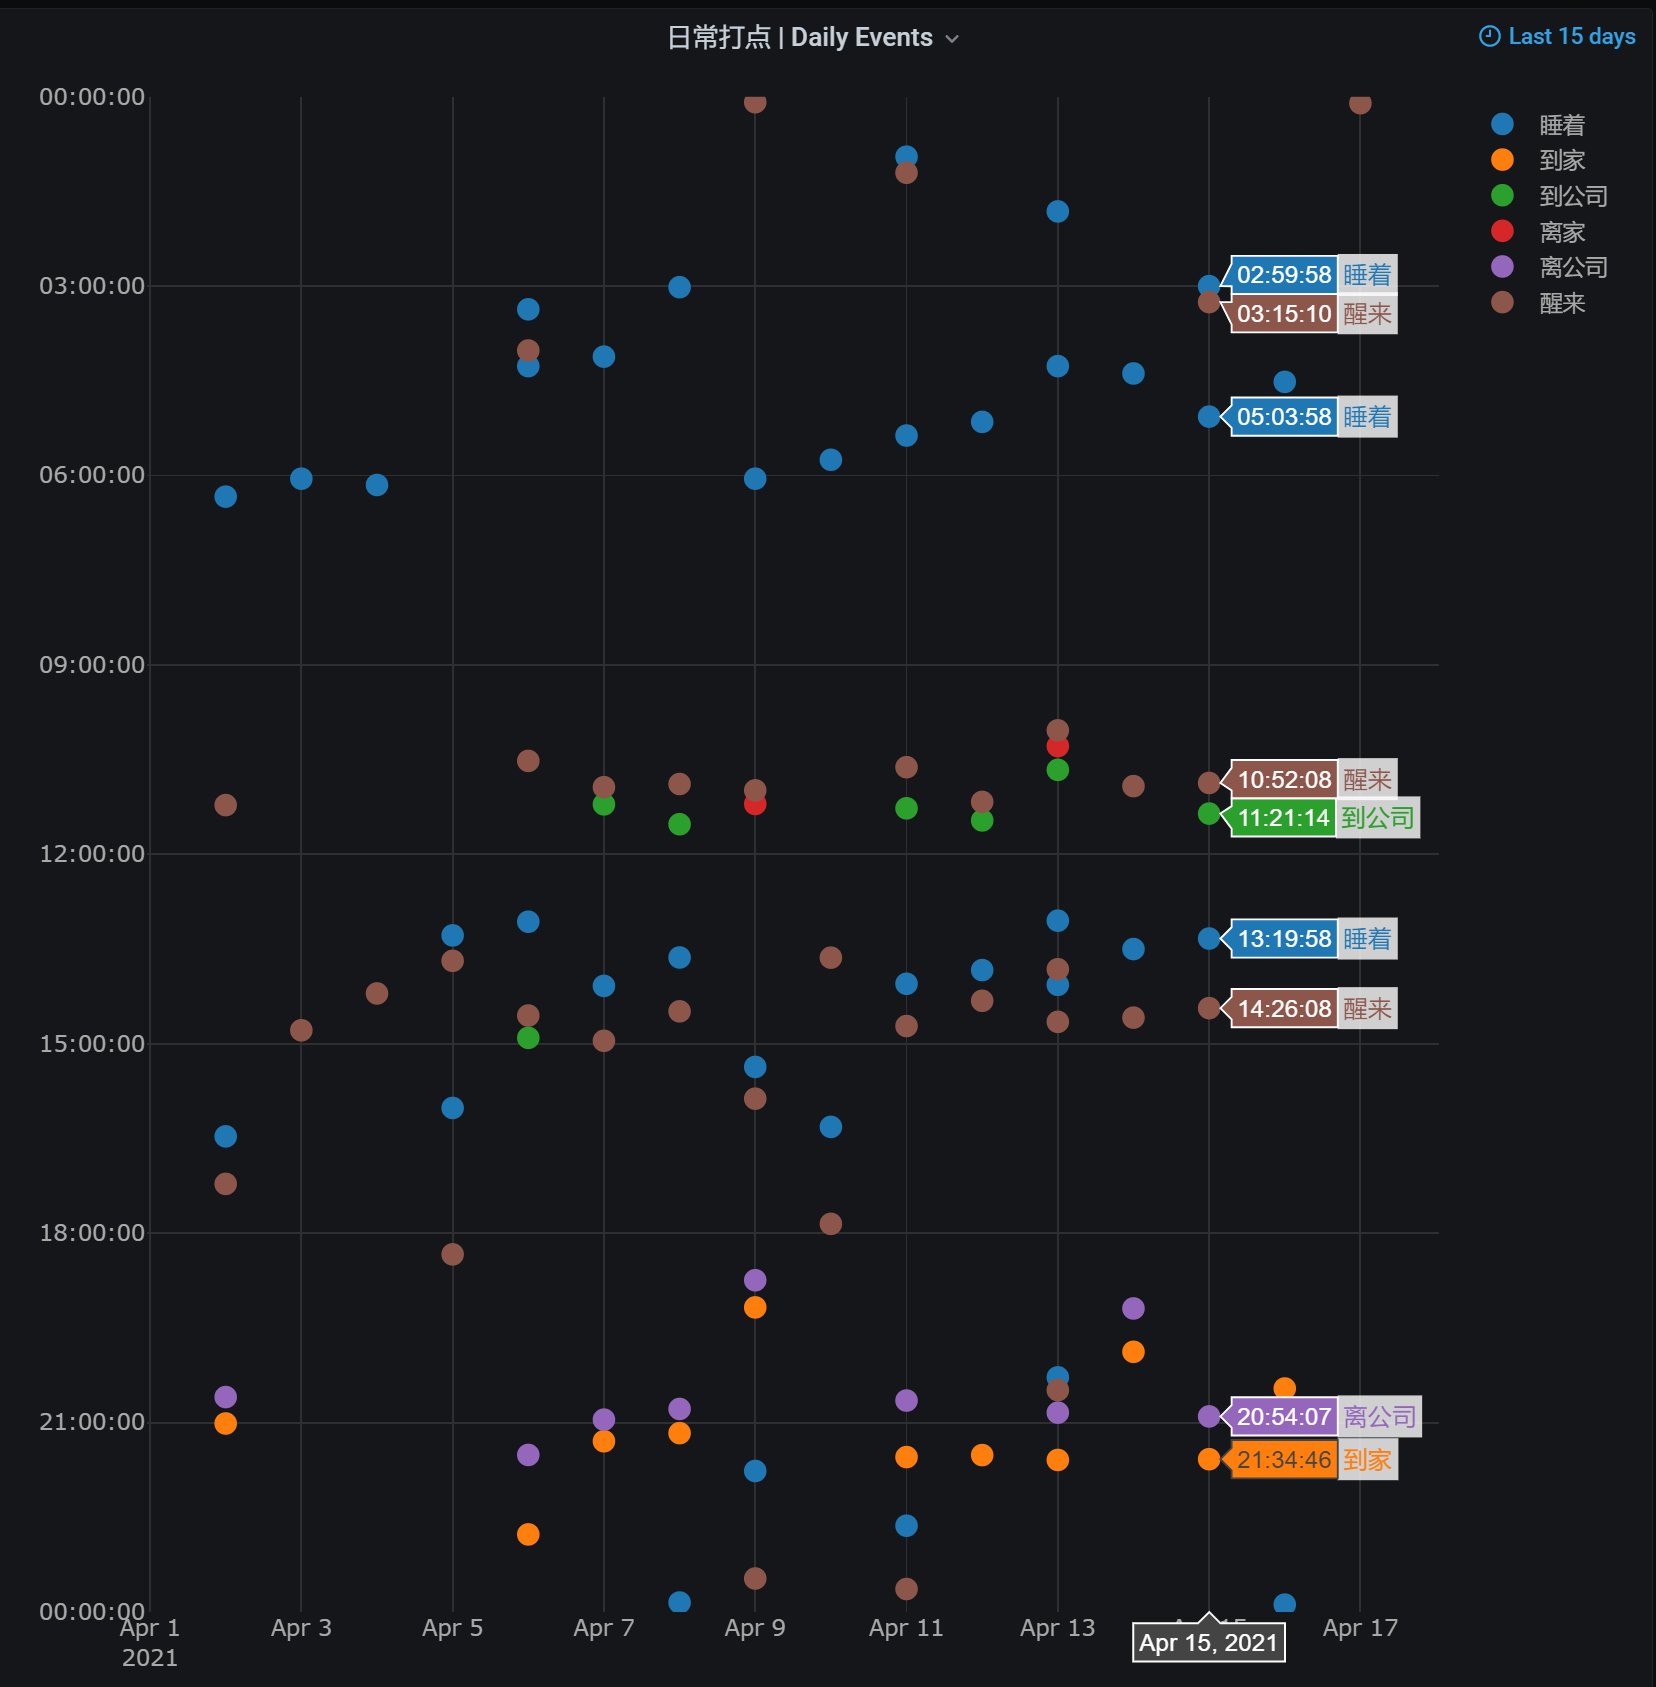
Each vertical line represents 0 to 24 o’clock in a day, and the corresponding event is represented by dots on this line, which can show the trend of various events on many days. In terms of implementation, the data source is still MongoDB:
[
    {"$match": {"ts": {"$gte": "$from", "$lt": "$to"}}},
    {"$project": {"name": "$event", "value": 1, "ts": "$ts", "_id": 0}}
]
Select Plotly Panel in the Panel settings. There are two main configurations, a Layout can set the chart style, and a Script can customize the data processing script.
Layout:
{
  "font": {
    "color": "darkgrey"
  },
  "paper_bgcolor": "rgba(0,0,0,0)",
  "plot_bgcolor": "rgba(0,0,0,0)",
  "margin": {
    "t": 10,
    "b": 40
  },
  "xaxis": {
    "type": "date",
    "gridcolor": "rgb(46, 47, 49)"
  },
  "hovermode": "x",
  "yaxis": {
    "gridcolor": "rgb(46, 47, 49)"
  }
}
Script:
let serieses = []

const getLocalISOString = (ts) => {
  d = new Date(ts)
  const tzOffset = d.getTimezoneOffset() * 60000
  return new Date(d - tzOffset).toISOString()
}

for (let s of data.series) {
  if (s.name) {
    let dates = s.fields[0].values.map(d => getLocalISOString(d).substr(0, 10))
    let values = s.fields[0].values.map(d => '2000-01-01 ' + getLocalISOString(d).substr(11, 8))
    serieses.push({
      name: s.name,
      x: dates,
      y: values,
      type: 'scatter',
      mode: 'markers',
      marker: { size: 12 },
    })
  }
}

return {
  data: serieses,
  layout: {
    xaxis: {
      tickformat: '',
    },
    yaxis: {
      tickformat: '%X',
      range: ['2000-01-01 23:59:59', '2000-01-01 00:00:00']
    }
  }
}
The main thing the script does is to traverse all events and set the x value of each event to the day and the y value to the time of the day. There is a very uncomfortable problem. When the mouse hovers over the corresponding column, only the first one of the same event of the day will display the label. That is to say, if you fall asleep multiple times that day, only the first fall asleep time will be displayed. come out. This problem is mentioned in an issue in the official warehouse, but no one has solved it, but I am very uncomfortable, so I simply changed it myself so that the same column can display multiple labels of the same type. The specific commit is inHere , Recompile and overwrite the corresponding files in the Grafana plug-in directory to use it, also under the original issueFeedback 。
The following is the statistical distribution of the duration of various events. The horizontal axis is the start time of the event, and the vertical axis is the end time of the event. In this wayy = - x + b The point on the line is the “isochronous line” where the event time is b. Multiple points can easily see the statistical law of various times, such as work:
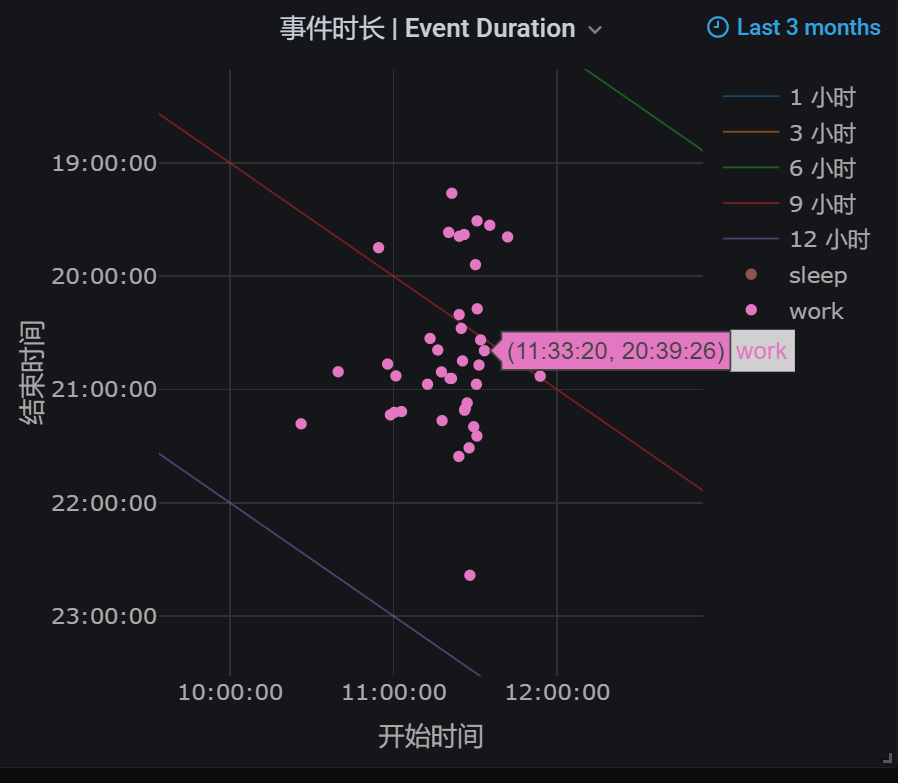
And sleep:
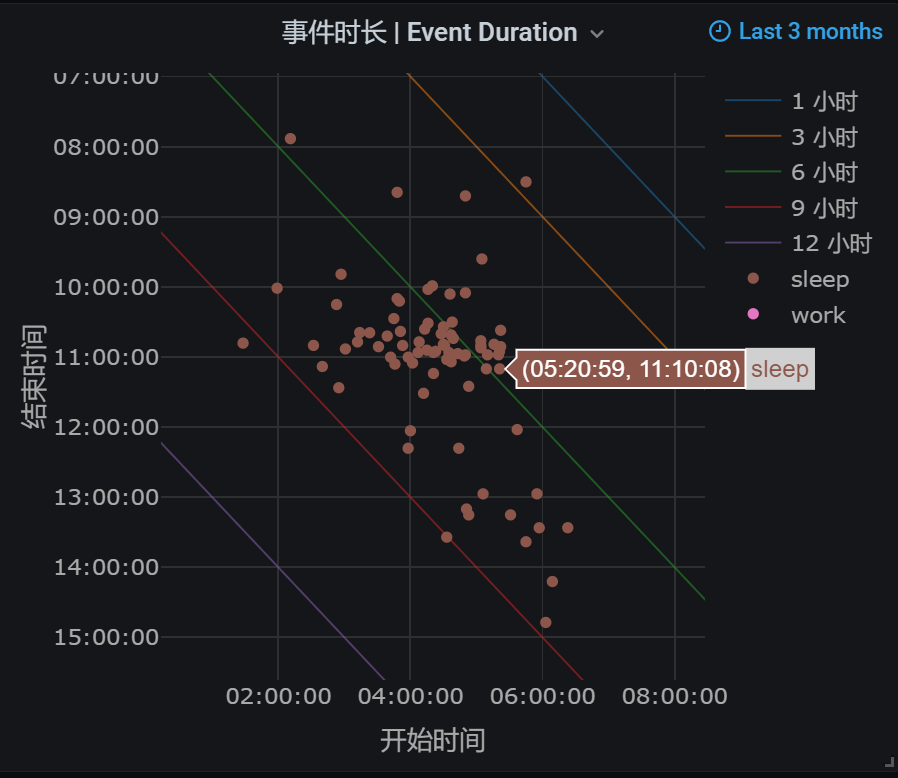
. The realization of the data source and layout is similar to the above, the data processing script:
const getLocalISOString = (ts) => {
  d = new Date(ts)
  const tzOffset = d.getTimezoneOffset() * 60000
  return new Date(d - tzOffset).toISOString()
}

let series = []

for (let hour of [1, 3, 6, 9, 12]) {
  let duration = hour * 3600000
  let y_start = duration
  let x_end = (24 - hour) * 3600000
  series.push({
    name: `${hour} 小时`,
    x: ['2000-01-01 00:00:00', '2000-01-01 ' + (new Date(x_end).toISOString()).substr(11, 8)],
    y: ['2000-01-01 ' + (new Date(y_start).toISOString()).substr(11, 8), '2000-01-01 23:59:59'],
    opacity: 0.5,
    mode: 'lines',
    line: {
      width: 1,
    }
  })
}

const plotEvent = (name, entryNames, leaveNames) => {
  let events = []

  for (let s of data.series) {
    if (entryNames.includes(s.name) || leaveNames.includes(s.name)) {
      events = events.concat(s.fields[0].values.map(d => ({
        name: s.name,
        ts: d
      })))
    }
  }

  events.sort((a, b) => a.ts - b.ts)

  let lastTime = null;
  let xs = [], ys = [];

  for (let ev of events) {
    if (entryNames.includes(ev.name)) {
      lastTime = '2000-01-01 ' + getLocalISOString(ev.ts).substr(11, 8)
    } else if (lastTime) {
      xs.push(lastTime)
      ys.push('2000-01-01 ' + getLocalISOString(ev.ts).substr(11, 8))
      lastTime = null
    }
  }

  series.push({
    name: name,
    x: xs,
    y: ys,
    type: 'scatter',
    mode: 'markers',
  })
}

plotEvent('sleep', ['睡着'], ['醒来'])
plotEvent('work', ['到公司'], ['离公司', '到家'])

return {
  data: series,
  layout: {
    xaxis: {
      tickformat: '%X',
      title: {
        text: '开始时间'
      }
    },
    yaxis: {
      tickformat: '%X',
      autorange: 'reversed',
      title: {
        text: '结束时间'
      }
    },
    hovermode: 'closest'
  }
}
It’s more troublesome here. First, find out all the state duration intervals according to the start time and end time of a state, and then calculate the start time and end time for x and y, and finally unify all dates into the same day.
to sum up
Doing these things is mainly out of interest (perhaps also the love of life?), in retrospect, it is also a long journey, doing various things and integrating them in turn. A lot of scripts were also written in this process. Tasker is especially interesting. The task uses the mobile phone as the running environment. This is perhaps the most relevant to the real world in the project I wrote. At the same time, I have done a lot of thinking about the management of life, energy, and health. I hope this system can accompany me for a period of time.